
One of the last developments in gvSIG, is the possibility to run R code from gvSIG. Now, we are not talking about the partial solution through Renjin, as we explained in a post, but a R installation that will be installed in our extension.
What is R?
R is a programming language focused on statistical computing. It has a huge and active community who developed a lot of projects and libraries using this language. One of the libraries that could be interesting for you is ‘rgdal‘. Using this library we could work with vector data, raster data, etc. It gives the chance to put together both worlds, statistical and geospatial ones.
For those who don’t know R and all the chances that it has, I recommend you to take a look in Google and look for all these projects with “R language” involved.
What is needed in R to be more useful in our field?
One of the lacks of R is a graphical environment focused on geospatial information. Of course, R has graphic output, map generation, but not all the functions that one desktop GIS could have, like gvSIG, where we have multiple options to visualize and interact with our data, or even creating our own tools like creating geoprocesses that involve part of the analysis in R.
What is the objective of this extension?
The main objective of this extension is to take advantage of the best of R, statistical analysis, and the best of gvSIG, layer interaction and visualization.
In a technical level, we could create a function, written in R, and using gvSIG to pass the parameters that it needs, and an environment where we can load the results, where we can continue working with them.
For example, we could have a script in R, that gets parameters as a path of a layer who is loaded in gvSIG, then processing this layer in R applying some statistical calculation or reprojections, and again, loading the output layer or table of the process in gvSIG.
Maybe these parameters are not fixed as a layer, but they could be X, Y coordinates that could be captured after a click event in a View inside gvSIG. The options are endless.
What R are we using it?
gvSIG is using an R installation inside the plugin. For example, it will allow us to have everything installed in a gvSIG portable version, and we will not need an external installation outside gvSIG. We continue developing this plugin so we keep studying some other alternatives to this behaviour.
What limitations do we have?
Right now we recommend to use the extension in Windows, because in this platform the library installation is easy to do inside R. We also put in some pre-installed packages with the main libraries in the geospatial R world. However, you also can use this extension in Linux, following the same steps except the library installation.
How can we test it?
We have included a basic example of R use, in which one we use the scripting module to execute this R script, giving to R some parameters, and getting them to load the results.
This example is made in Windows, but you can try it also in Linux, just remember to download the Linux version of the package.
First of all we have to install the R extension from the Add-ons Manager. If we are using a portable version, it won’t be needed.
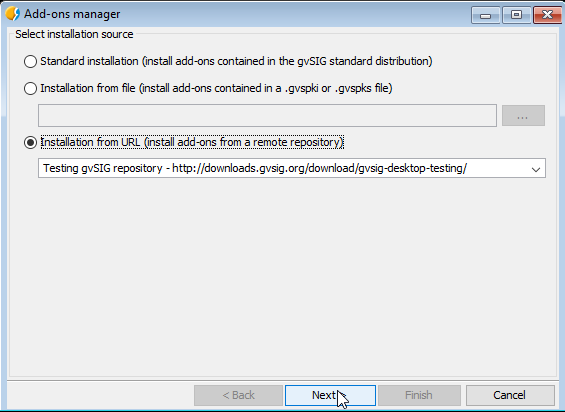
Select the Windows package version:

And press ‘Start download’:

We have to press Next to complete the installation. It could take a while because of the package size:
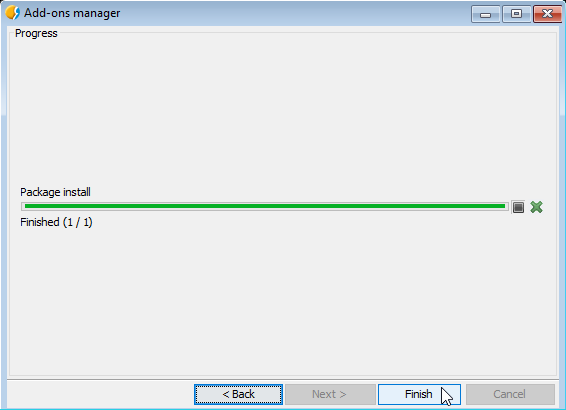
Once it is installed, we should restart gvSIG.
Having gvSIG opened again, for our example, we have to create a new View with EPSG 25830 projection, to load here our data.
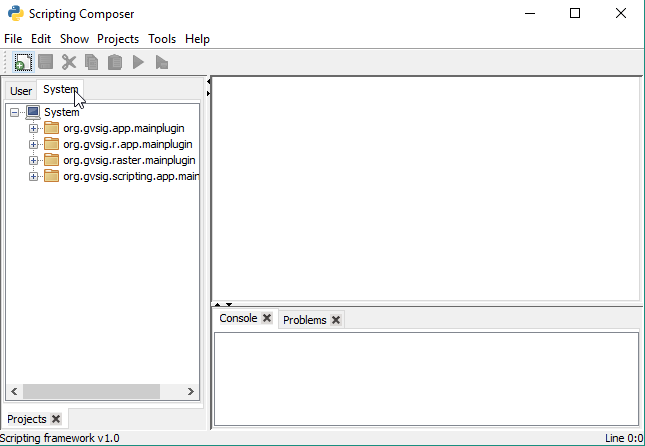
Now we will go to Tools – Scripting – Scripting Composer:

On the System menu, we could find our R plugin:
We will execute the RShell script to open the R console that is inside gvSIG:
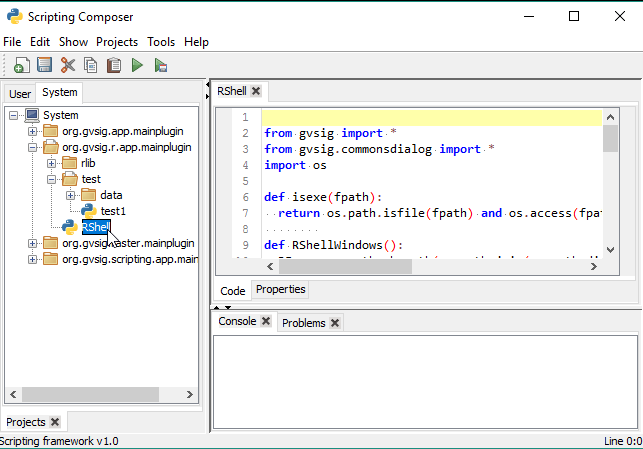
Press the button:

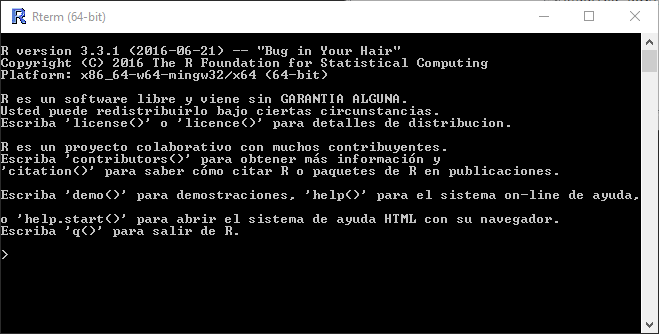
It will open a console like in the image, that correspond with the R environment that is inside gvSIG:
The libraries that are at this installation are the next ones:
install.packages(c(
 'stpp','rgdal','maptools','splancs','spatstat','mgcv','BB','bbmle','plyr','raster',
 'sqldf','lubridate','rgeos','RPostgreSQL','RODBC','pixmap','sp','spdep','RColorBrewer',
 'foreign','plotrix','geoR','fields','maps', 'gridExtra','tweet2r','ggmap','ROAuth','RSQLite',
 'ggplot2','streamR', 'scales'
 ))
 install.packages('INLA', repos='http://www.math.ntnu.no/inla/R/stable')
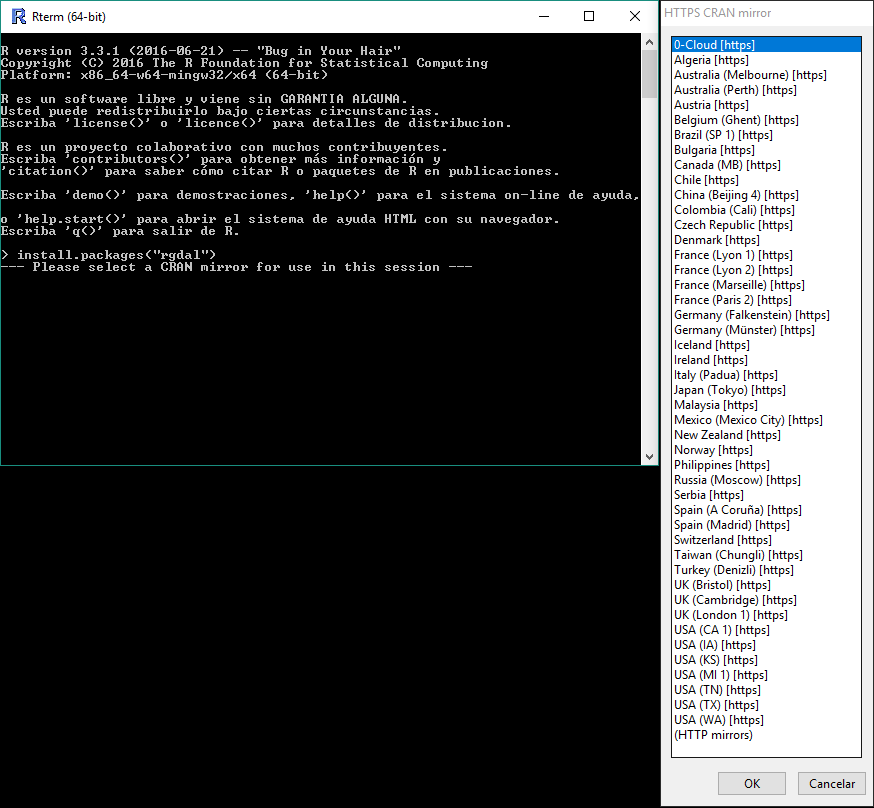
If you need to install a new package to execute some of your scripts, you just will need to execute this command on the console:
install.packages("libraryName")
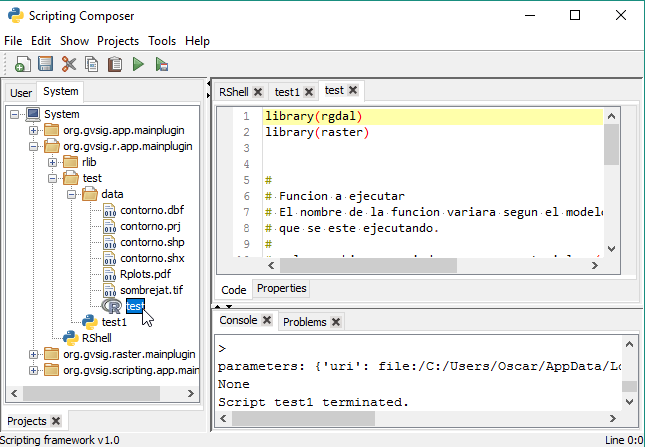
Now, we are going to execute our R script. On the Test folder we will find an R example code:

If we execute it, we will see all the data over the Scripting Composer console:
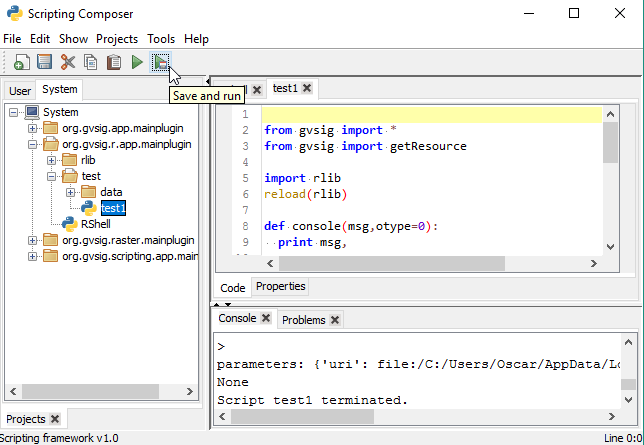
This script is executing the R code script that we have inside the /data/ folder. Also, we can edit this script directly from the Scripting Composer.
Detail of the output console:

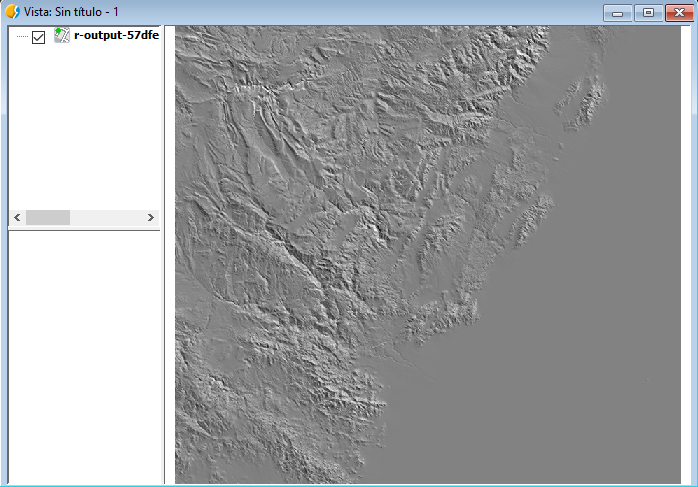
If we open our View, we will see a raster layer. This layer has been generated in R, and loaded in gvSIG.
And this is the end of the post. We continue developing this module, any feedback or help from you would be appreciated. We hope to keep posting new updates from the new development in this extension.
Any doubt you can contact us in the User or Developer mail list.


Pingback: gvSIG 2.3 is now available! | gvSIG blog